
CARD PRIVILEGES
Tools & Tips

PROPERTY LOAN PROMOTIONS

Featured Solutions

Featured
Guide

Featured Promotion

TMRW made more rewarding
View and redeem your rewards on the UOB TMRW app. Enjoy exclusive deals and UOB coupons in the palm of your hand.
Find out more-
you are in Personal Banking

For Individuals
Wealth BankingPrivilege BankingPrivate BankUOB ReferralFor Companies
Business BankingWholesale BankingForeign Direct InvestmentUOB ASEAN InsightsIndustry InsightsUOB Islamic Banking
Islamic BankingAbout UOB
Corporate ProfileStakeholder RelationsUOB Digitalisation


Topic 1: The economic and market impact of President-elect Trump’s policies
With Donald Trump starting his second term as President of the United States (US) on 20 January, his proposed policies have become the major concern for investors around the world.
President-elect Trump has outlined his top three priorities are tax cuts, deregulation and trade tariffs. Based on currently available information, the potential beneficiaries are identified below.
Individual and corporate tax cuts
One of the Trump administration’s top priorities is the extension of the 2017 Tax Cuts and Jobs Act (TCJA), and to reduce the corporate tax rate from 21% to as low as 15%. These changes could support consumer spending and boost US corporate earnings, driving the stock market higher. As reference, during President-elect Trump’s first term, the expectation of tax cuts drove a sharp rally in US stocks across 2017 where the S&P 500 Index gained nearly 22%![]() , the NASDAQ Composite rose nearly 30%
, the NASDAQ Composite rose nearly 30%![]() while the Russell 2000 Index of small-cap stocks delivered nearly 15%
while the Russell 2000 Index of small-cap stocks delivered nearly 15%![]() gains.
gains.
There are consequences, nonetheless. The Congressional Budget Office (CBO) estimates that US national debt could rise significantly over the next decade because of Trump’s policies. This will place more pressure on US government bonds as investors will question the sustainability of US debt.
Deregulation
The financial sector may see looser regulatory requirements, allowing banks and other financial institutions the ability to allocate their capital efficiently via business expansion, higher dividend payouts and increased share buybacks. This will be beneficial to financial stocks. Since the election, the US financials sector has outperformed the S&P 500 by 1.63%![]() .
.
Likewise, deregulation also allows the technology sector to boost innovation, ultimately resulting in higher corporate profits.
Trade tariffs
During his election campaign, President-elect Trump proposed a 10% universal tariff and up to 60% tariffs on Chinese goods. Post-election, Trump announced he plans to impose a 25% tariff on imports from Mexico and Canada alongside a 10% tariff on imports from China on his first day in office. Non-US markets, particularly China, have recorded losses since the US election.
Tariffs are inflationary by nature and will have a negative impact on economic growth, particularly if other countries retaliate with tit-for-tat measures. While we believe President-elect Trump will use the tariff threat as an opening negotiation ploy to yield concessions from trade partners, his first term highlights that investors should be mindful of a deterioration in global trade relations.
The full scope of Trump’s tariff agenda remains unclear for now, although we highlight the potential economic implications for three different scenarios (Figure 6). Our base-case expectation is for a measured and phased imposition of tariffs, including an additional 25% tariff on China and 10% tariffs on countries with a rising trade surplus against the US as a result of trade diversion from China.
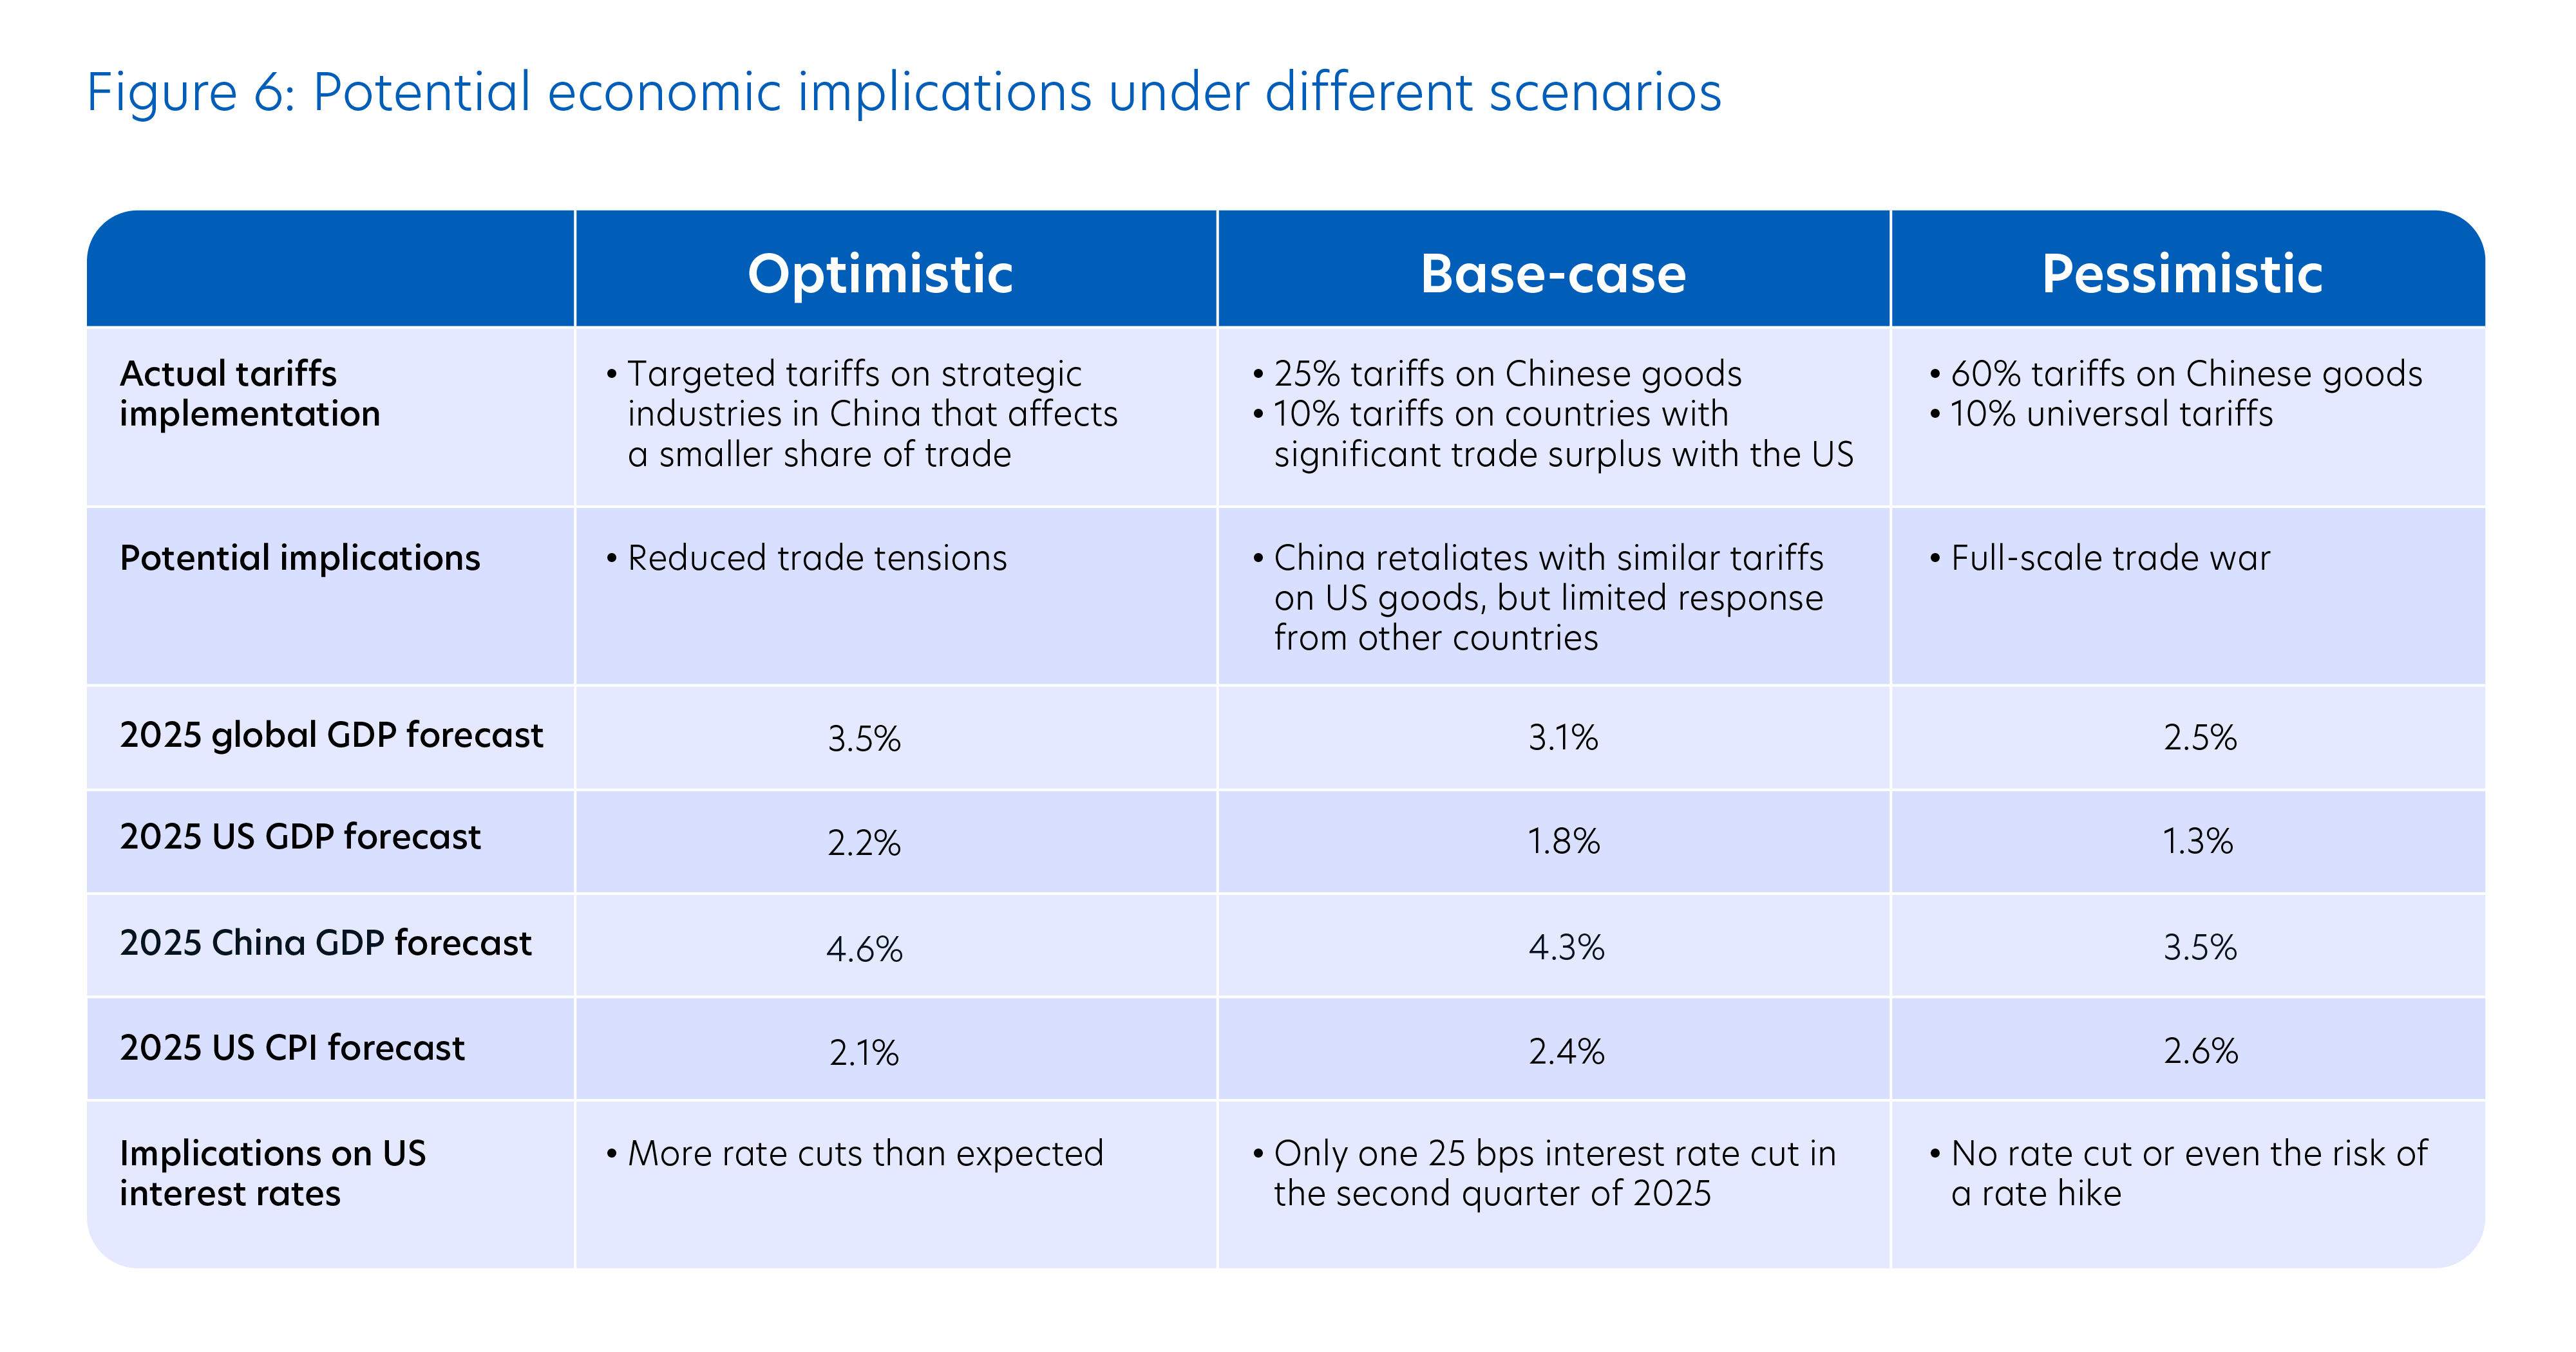
Source: UOB Global Economics & Market Research (13 January 2025)
Greater clarity of the scale and timeline of any US tariffs, and any retaliatory measures by other countries, is required to assess the true economic impact.
The potential winners from Trump 2.0
In summary (Figure 7), corporate tax cuts will benefit US companies in general by improving corporate earnings and incentivising businesses to shift operations back to the US. With more capital in their balance sheet, companies can allocate more resources to business investments which can spur jobs creation and economic growth in the US.
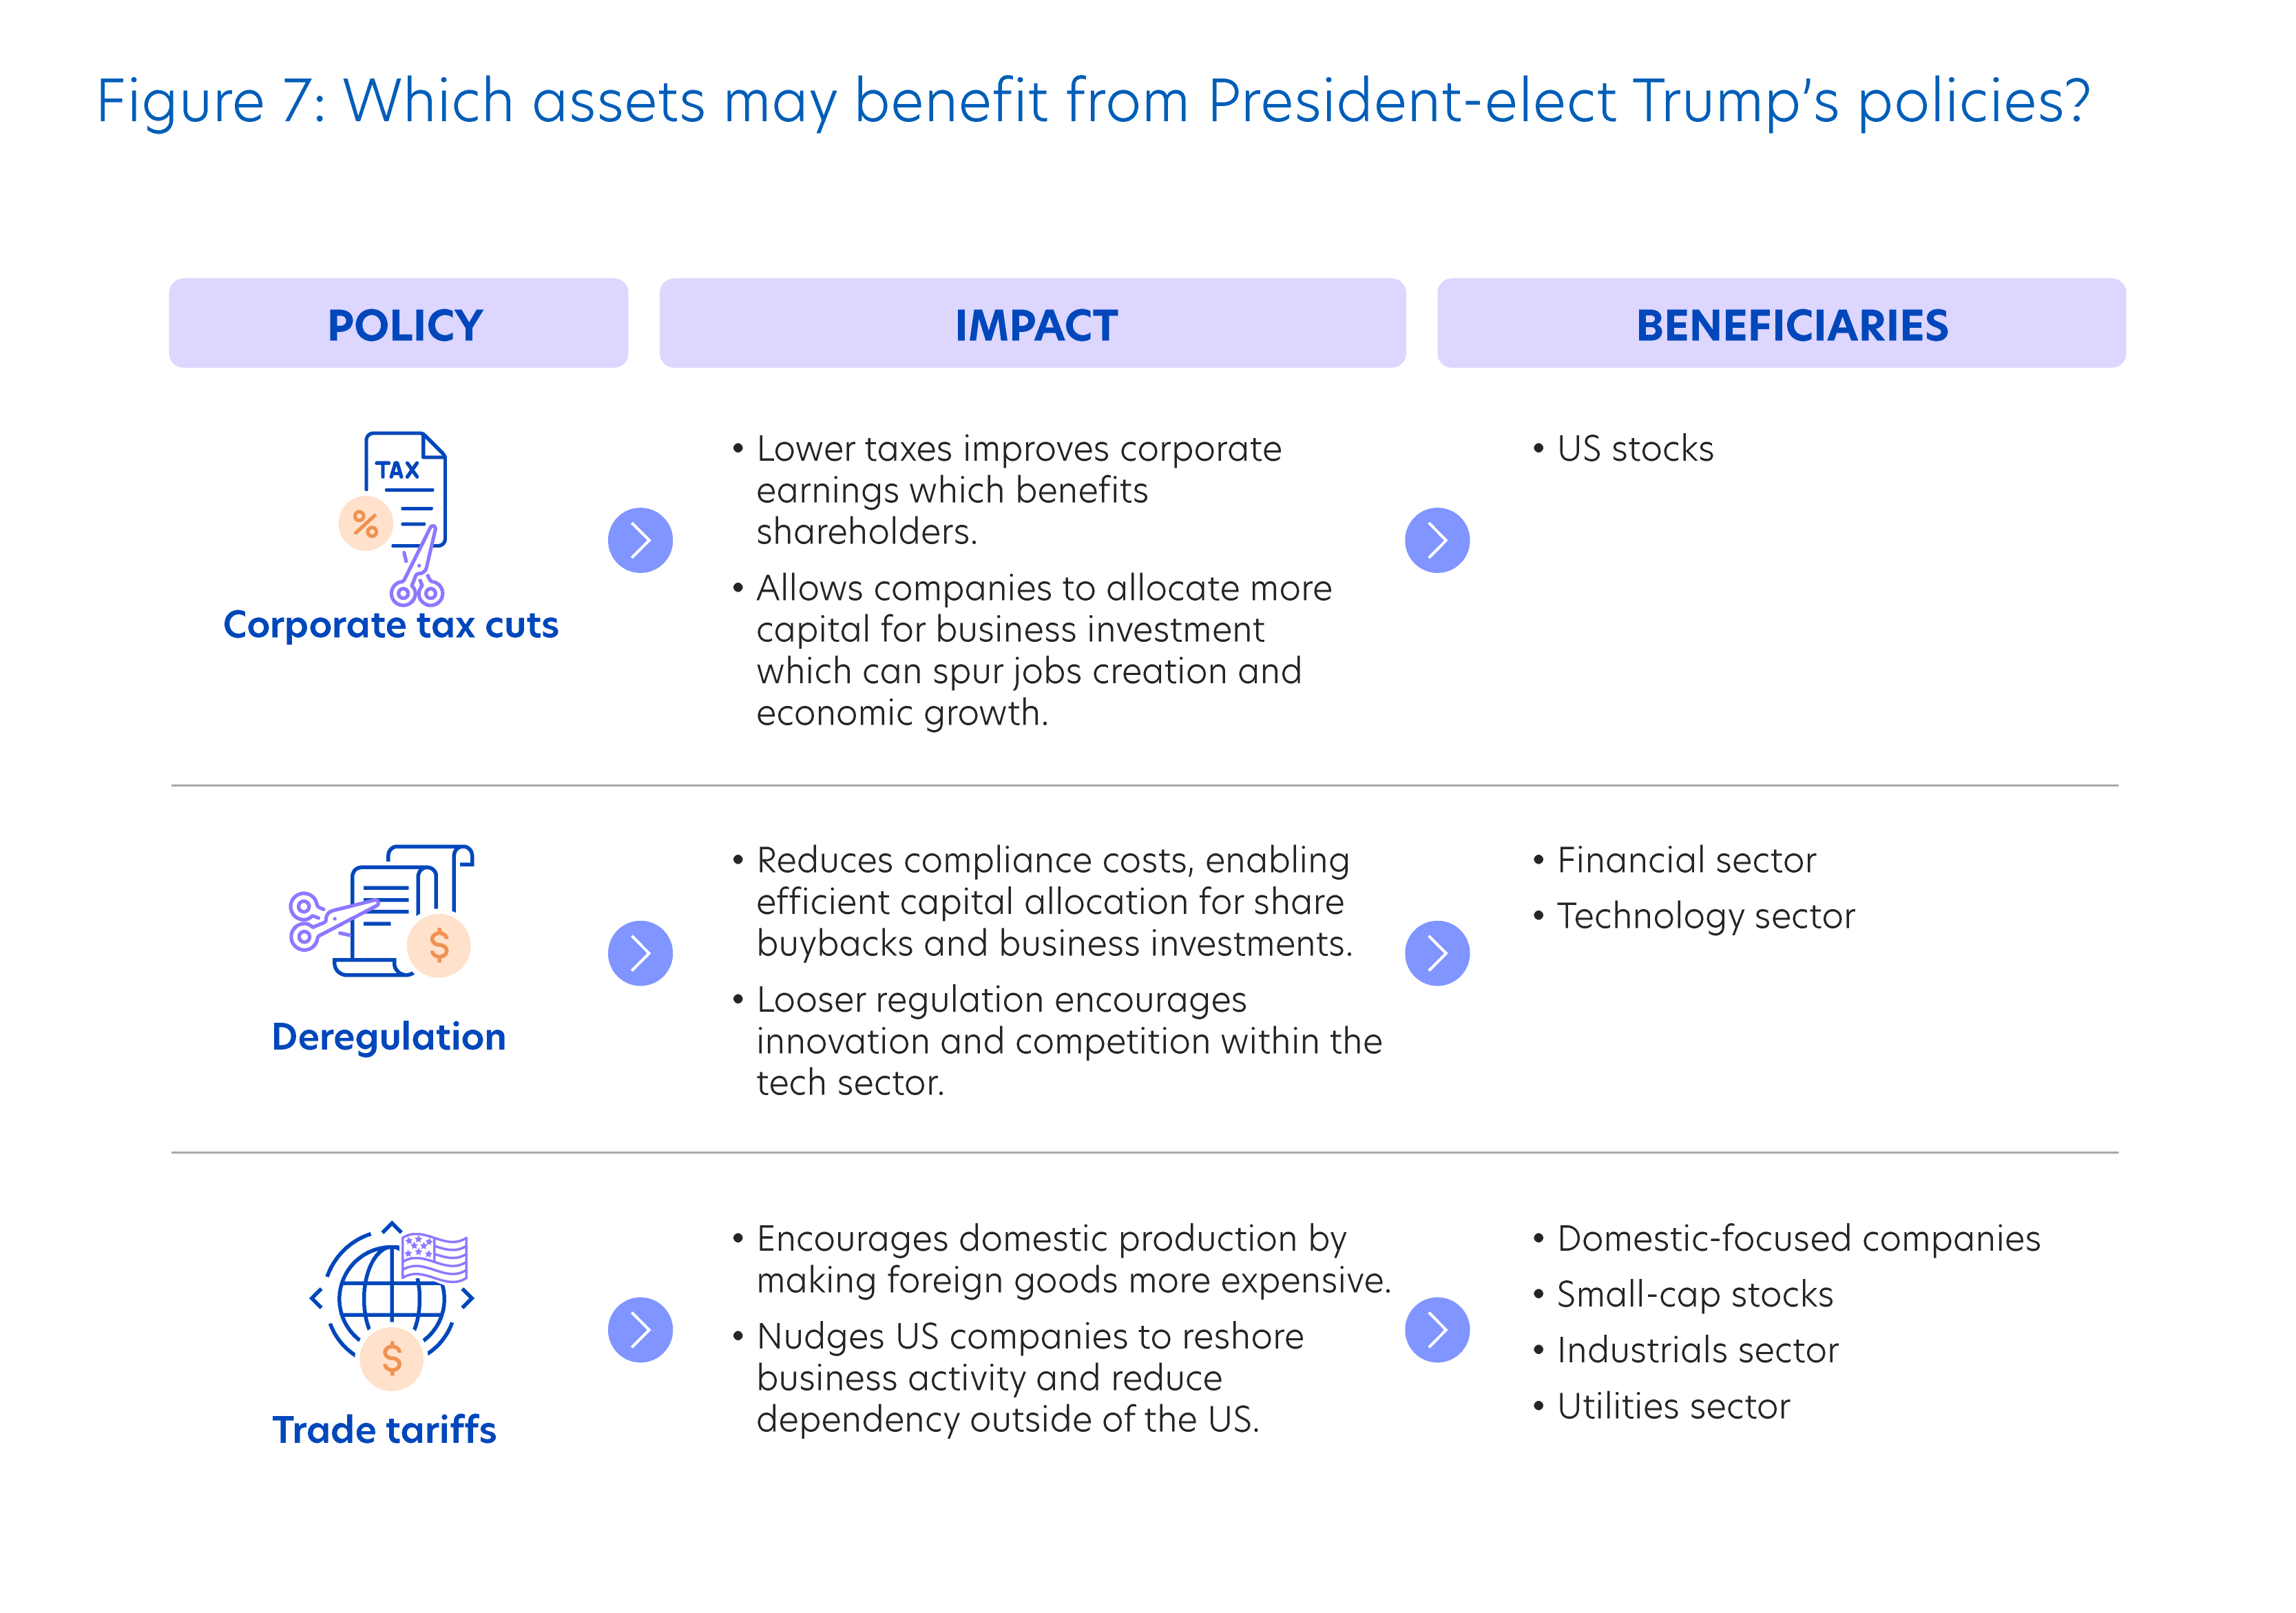
Source: UOB Wealth Management Advisory (30 November 2024)
The financial and technology sectors will benefit from deregulation, while domestic-focused companies may be indirect beneficiaries of higher trade tariffs. As foreign imports become more expensive, US small-cap companies will become more competitive. Defensive sectors like industrials and utilities with limited exposure to offshore production also stand to benefit.
While these stand out as potential winners, it is important to note that predicting future market performance is challenging and the outlook will only be clearer once the scale of Trump’s actual policies is known. As such, investors should focus on long-term investment strategies and financial objectives.
Topic 2: How to approach Asian stock investments in 2025?
Investors should be agile and proactive in their exposure to Asian stocks. There are potential headwinds ahead that will weigh on Asian stock market sentiment. At the same time, we should not lose sight of certain positive factors. Investors should seek a strategy that can potentially offer returns regardless of whether the market goes up or down.
Asia’s economic growth may briefly diverge from the United States (US)
Historically, Asia’s economic growth is invariably tied to the health of the US economy. Periods of strong growth in the US typically benefits Asia.
There may be a brief divergence in 2025 due to the potential headwind of trade tensions. Looking back at 2018, the second year of President-elect Trump’s first term, Asia ex-Japan’s economic growth slowed despite a pick-up in the US economy due to concerns of higher tariffs (Figure 8).
Such an outcome may be repeated this year. The silver lining is that resilient US consumption demand may limit the weakness of Asian economies.
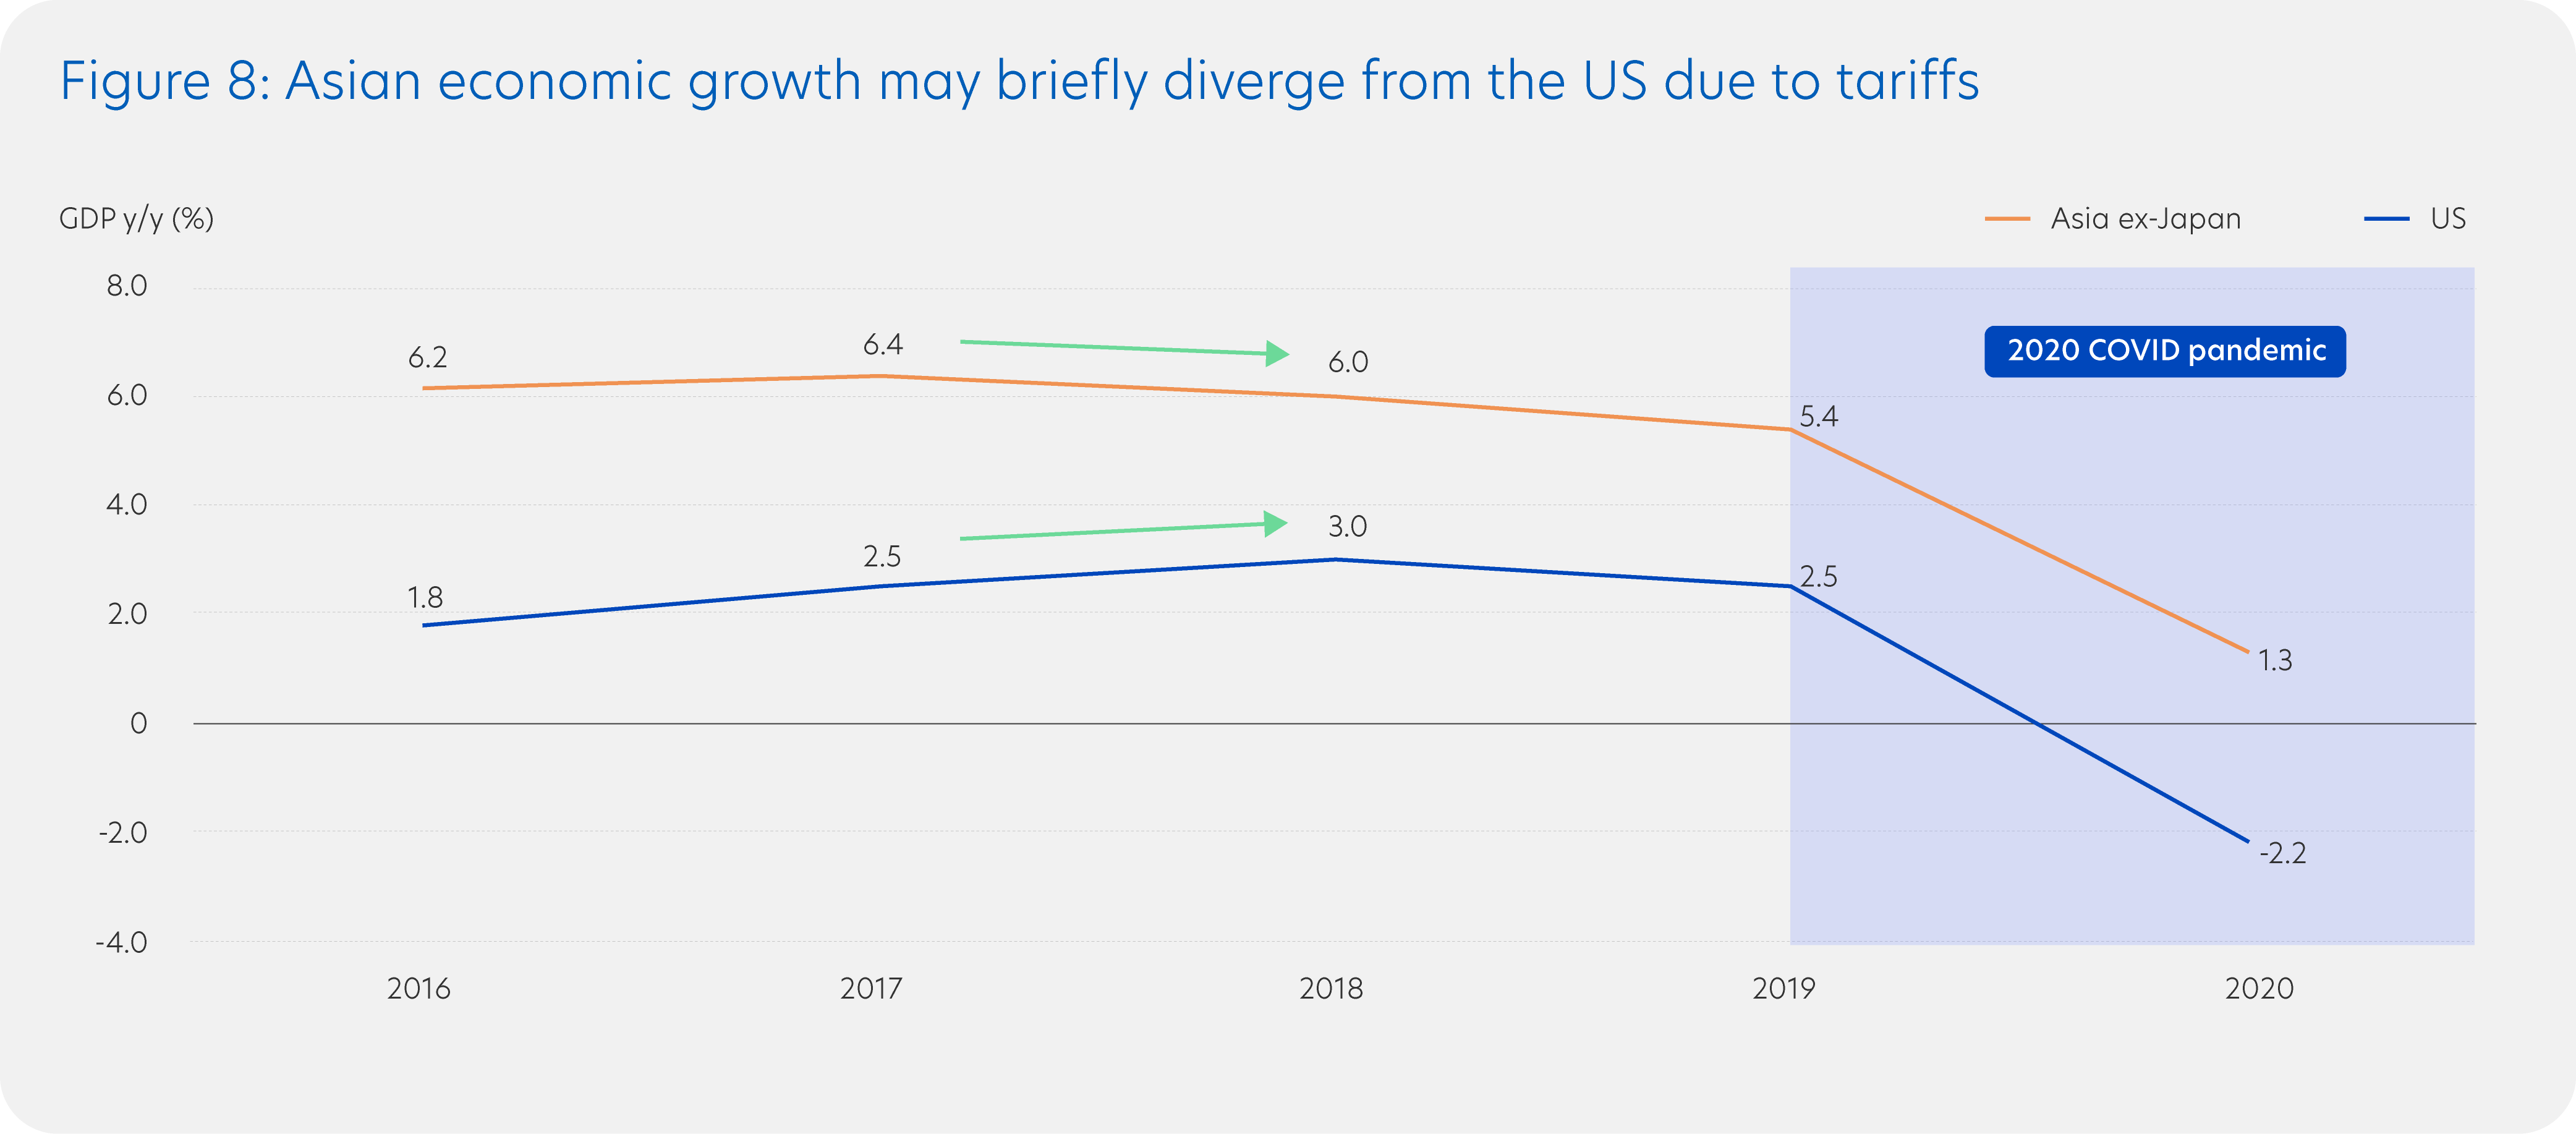
Source: Bloomberg (30 November 2024)
Potential US tariffs is the key risk
It is difficult to ascertain the true impact of US tariff policies, and we would caution against jumping to premature conclusions at this moment. However, it represents a key risk for Asian economies, particularly export-reliant ones.
If tariffs are raised aggressively, it will lead to higher US inflation and weaker US consumer demand and have a negative impact on global trade and Asian economic growth.
But this is far from a certain outcome. US President-elect Trump’s transactional approach means his tariff proposal may well be a negotiating tactic that eventually leads to individual trade deals or economic concessions from other countries.
While the US is targeting a relocation of production onshore, the build-up of infrastructure within the US will take time. In the meanwhile, the lack of supply chain alternatives may dilute the scope of actual tariffs, leading to potential tariff exemptions for certain goods. If these scenarios come true, it will limit the negative impact on Asian economic growth.
China’s economic policies also matter
The other thing to consider is China’s economic growth in 2025. In recent months, the Chinese government has signalled increased support for the domestic economy to cope with the many headwinds. That said, the scale of government support measures is yet to be known, so it is unclear if and when a significant growth recovery will take place.
If China delivers significant fiscal and monetary stimulus that leads to a successful recovery in domestic consumption and the housing market, China’s corporate earnings will improve. If this happens, it will be positive for Chinese stocks that are already underpinned by attractive valuations. It will also be positive for Asian economies and stocks.
Asian stock valuations are attractive
When we look back at the 2018 peak in US-China trade tensions, the MSCI Asia ex-Japan Index then traded at a valuation discount of 34.5% against the MSCI World Index. Currently, even before trade tensions escalate dramatically, Asia ex-Japan stocks are trading at an even bigger valuation discount of 55.3% against global peers.
Furthermore, the corporate earnings outlook for Asia ex-Japan is projected to be robust in 2025, outpacing global peers. The combination of a significant valuation discount and stronger earnings outlook are reasons why Asian stocks may not see drastic declines even if trade tensions escalate (Figure 9).
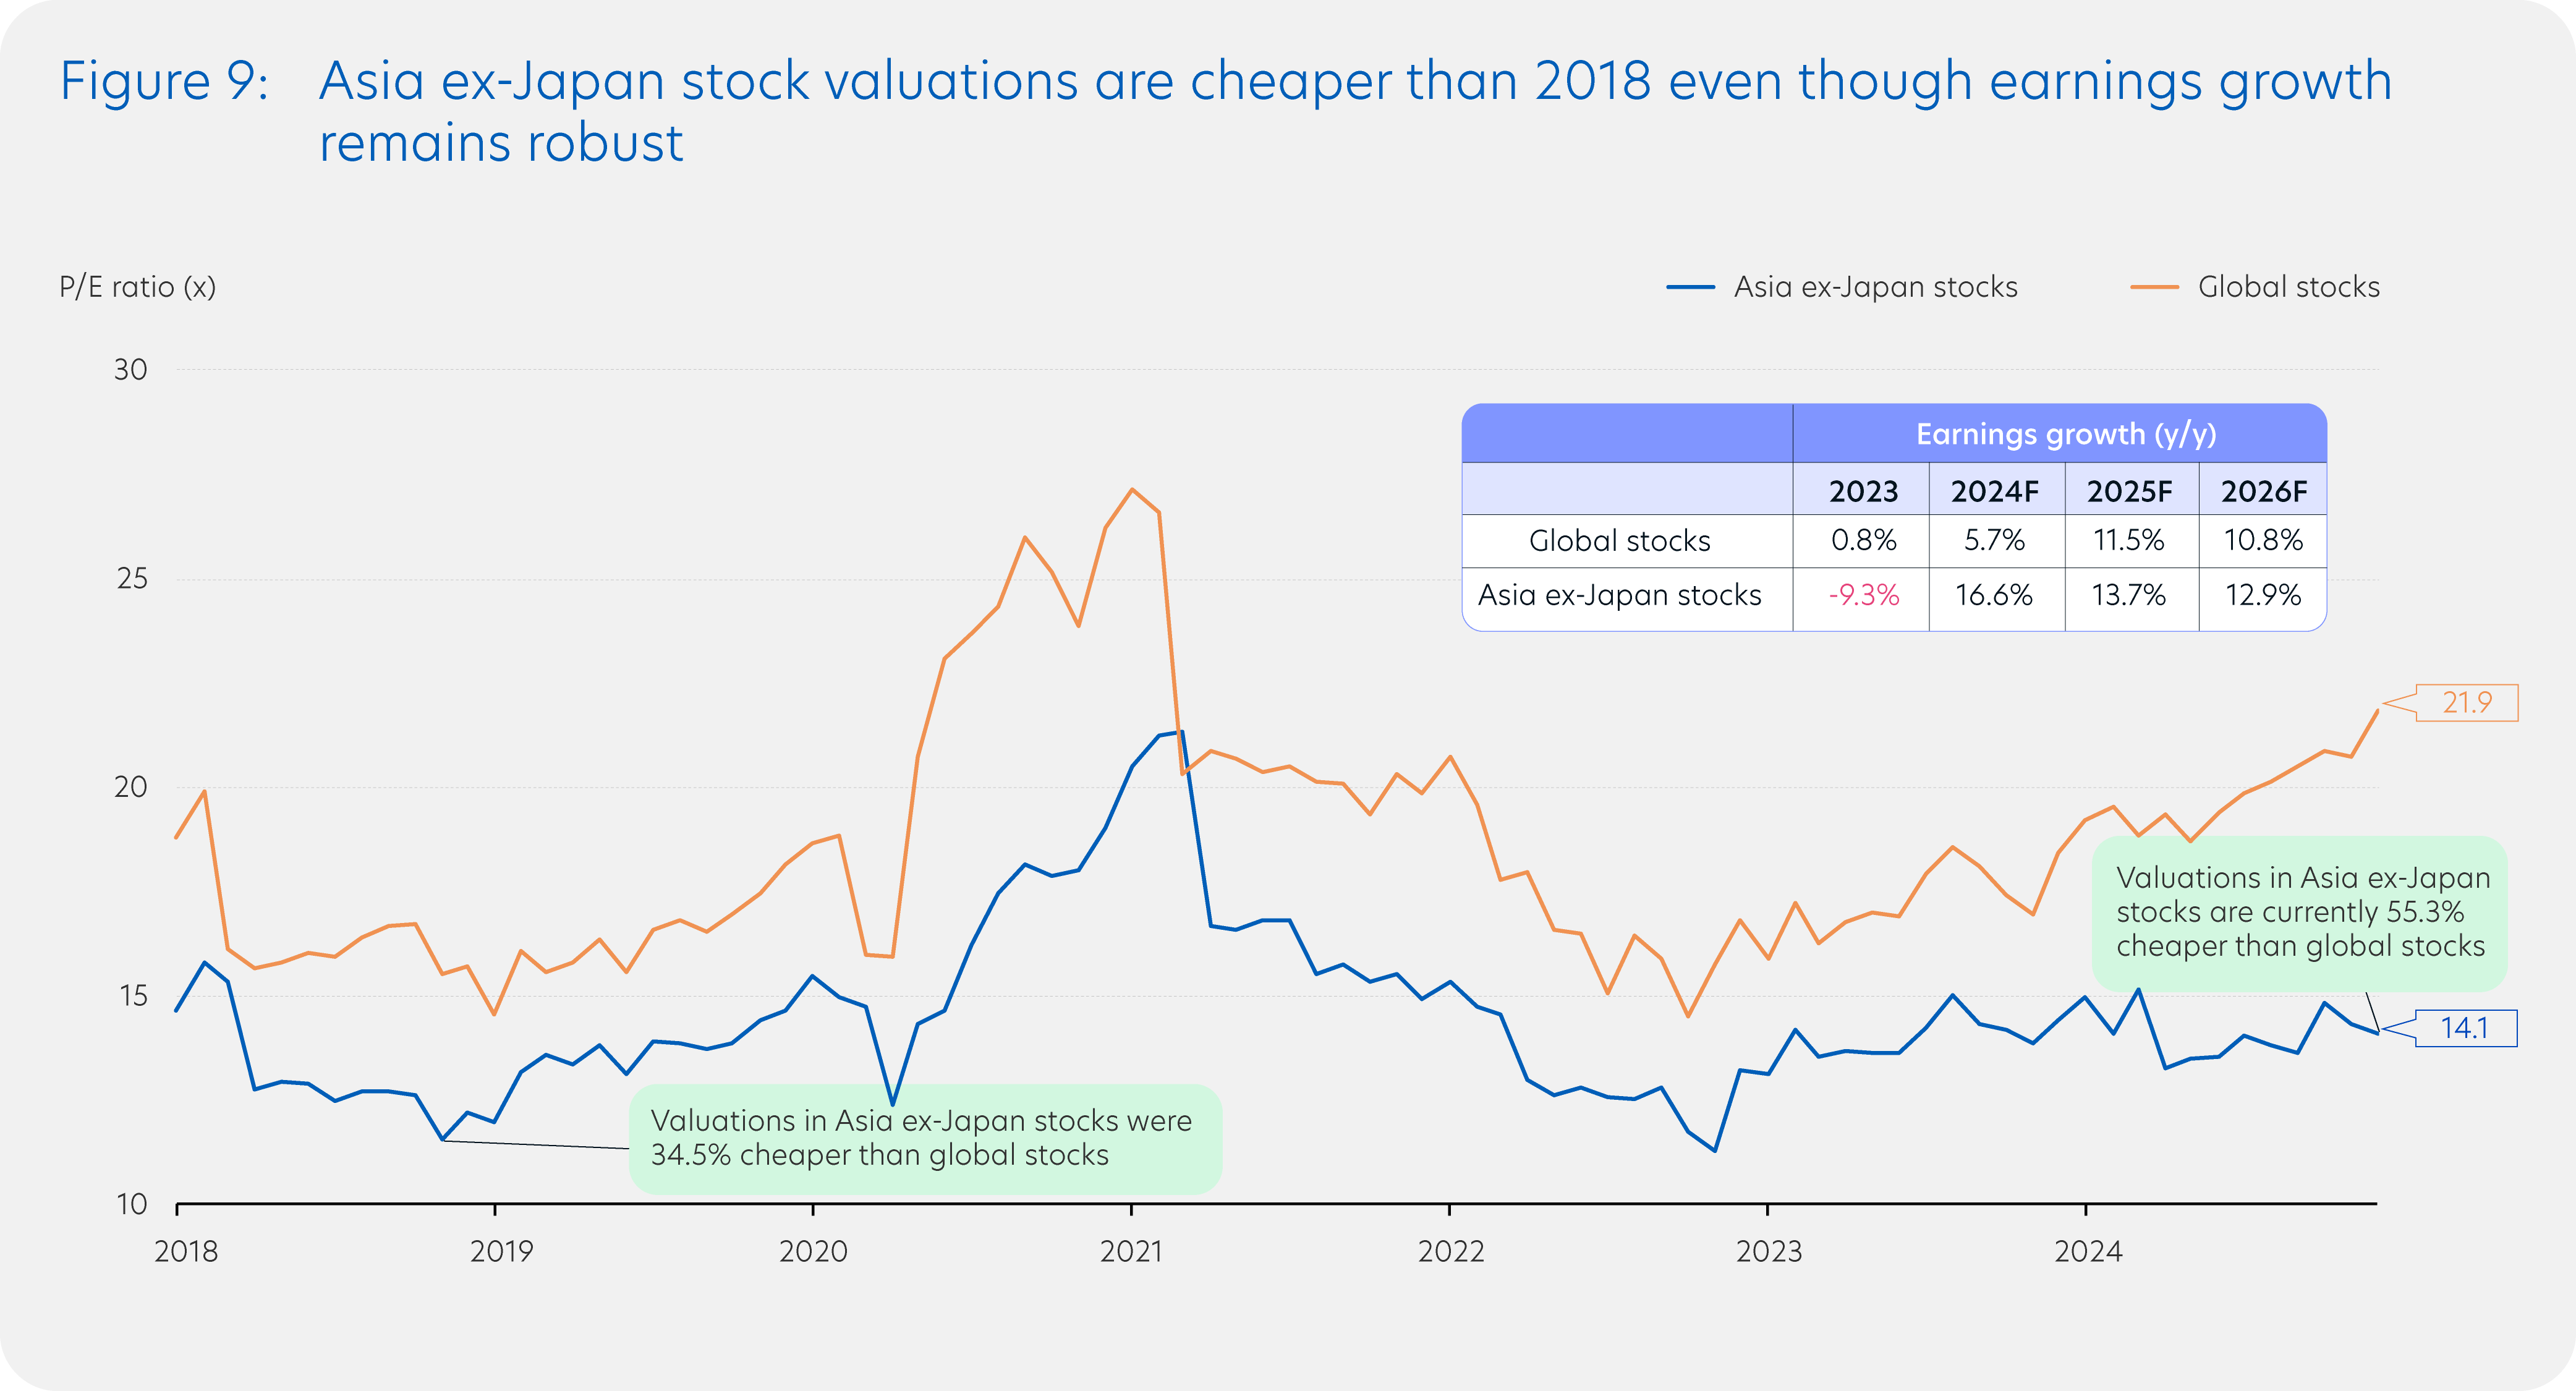
Global stocks refer to MSCI World Index. Asian stocks refer to MSCI Asia ex-Japan Index. P/E ratio measures a company's share price relative to its per-share earnings, a measure used to value a company stock relative to the net profit it generates. F represents forecast data by analysts.
Source: Bloomberg (30 November 2024)
Stay agile and proactive
The Asian stock market outlook is uncertain and there will likely be short-term volatility due to US policy shifts. Asian companies that are less reliant on external trade and focuses more on domestic-oriented businesses may fare comparatively better across this year. Quality Asian dividend stocks also offer attractive investment income.
Investors should stay agile and proactive, and a market neutral strategy for Asia designed to potentially generate returns regardless of whether the market goes up or down will allow investors to seize opportunities and lower portfolio volatility.
Investors can also consider a diversified exposure to ASEAN via funds.
Topic 3: Build income portfolio beyond cash or fixed deposits
Holding cash or fixed deposits is not the only way to earn income. While global economic growth is likely to slow, it is still expected to expand. In this environment, investment grade bonds and quality dividend stocks present attractive alternatives to build investors’ income portfolio.
Cash or fixed deposits should only be one part of your portfolio
Since 2022, cash and fixed deposits gained popularity as global central banks raised interest rates aggressively to combat multi-decade-high inflation. Higher deposit rates offered competitive returns with minimal risk, while the outlook for stocks and bonds were complicated by higher interest rates.
Given uncertainty over the outlook for inflation and interest rates, cash and fixed deposits still represents a low-risk and liquid way to earn income. The downside is that cash and fixed deposits fail to beat inflation over the long term. This is why cash or fixed deposits should only be one part of your portfolio. Investors should instead seek opportunities to build additional income that can keep pace with inflation through investment grade bonds and quality dividend stocks.
Investment grade bonds remain appealing
The difference in yield between cash and investment grade bonds has widened over the second half of 2024 (Figure 10), enhancing the appeal of investment grade bonds.
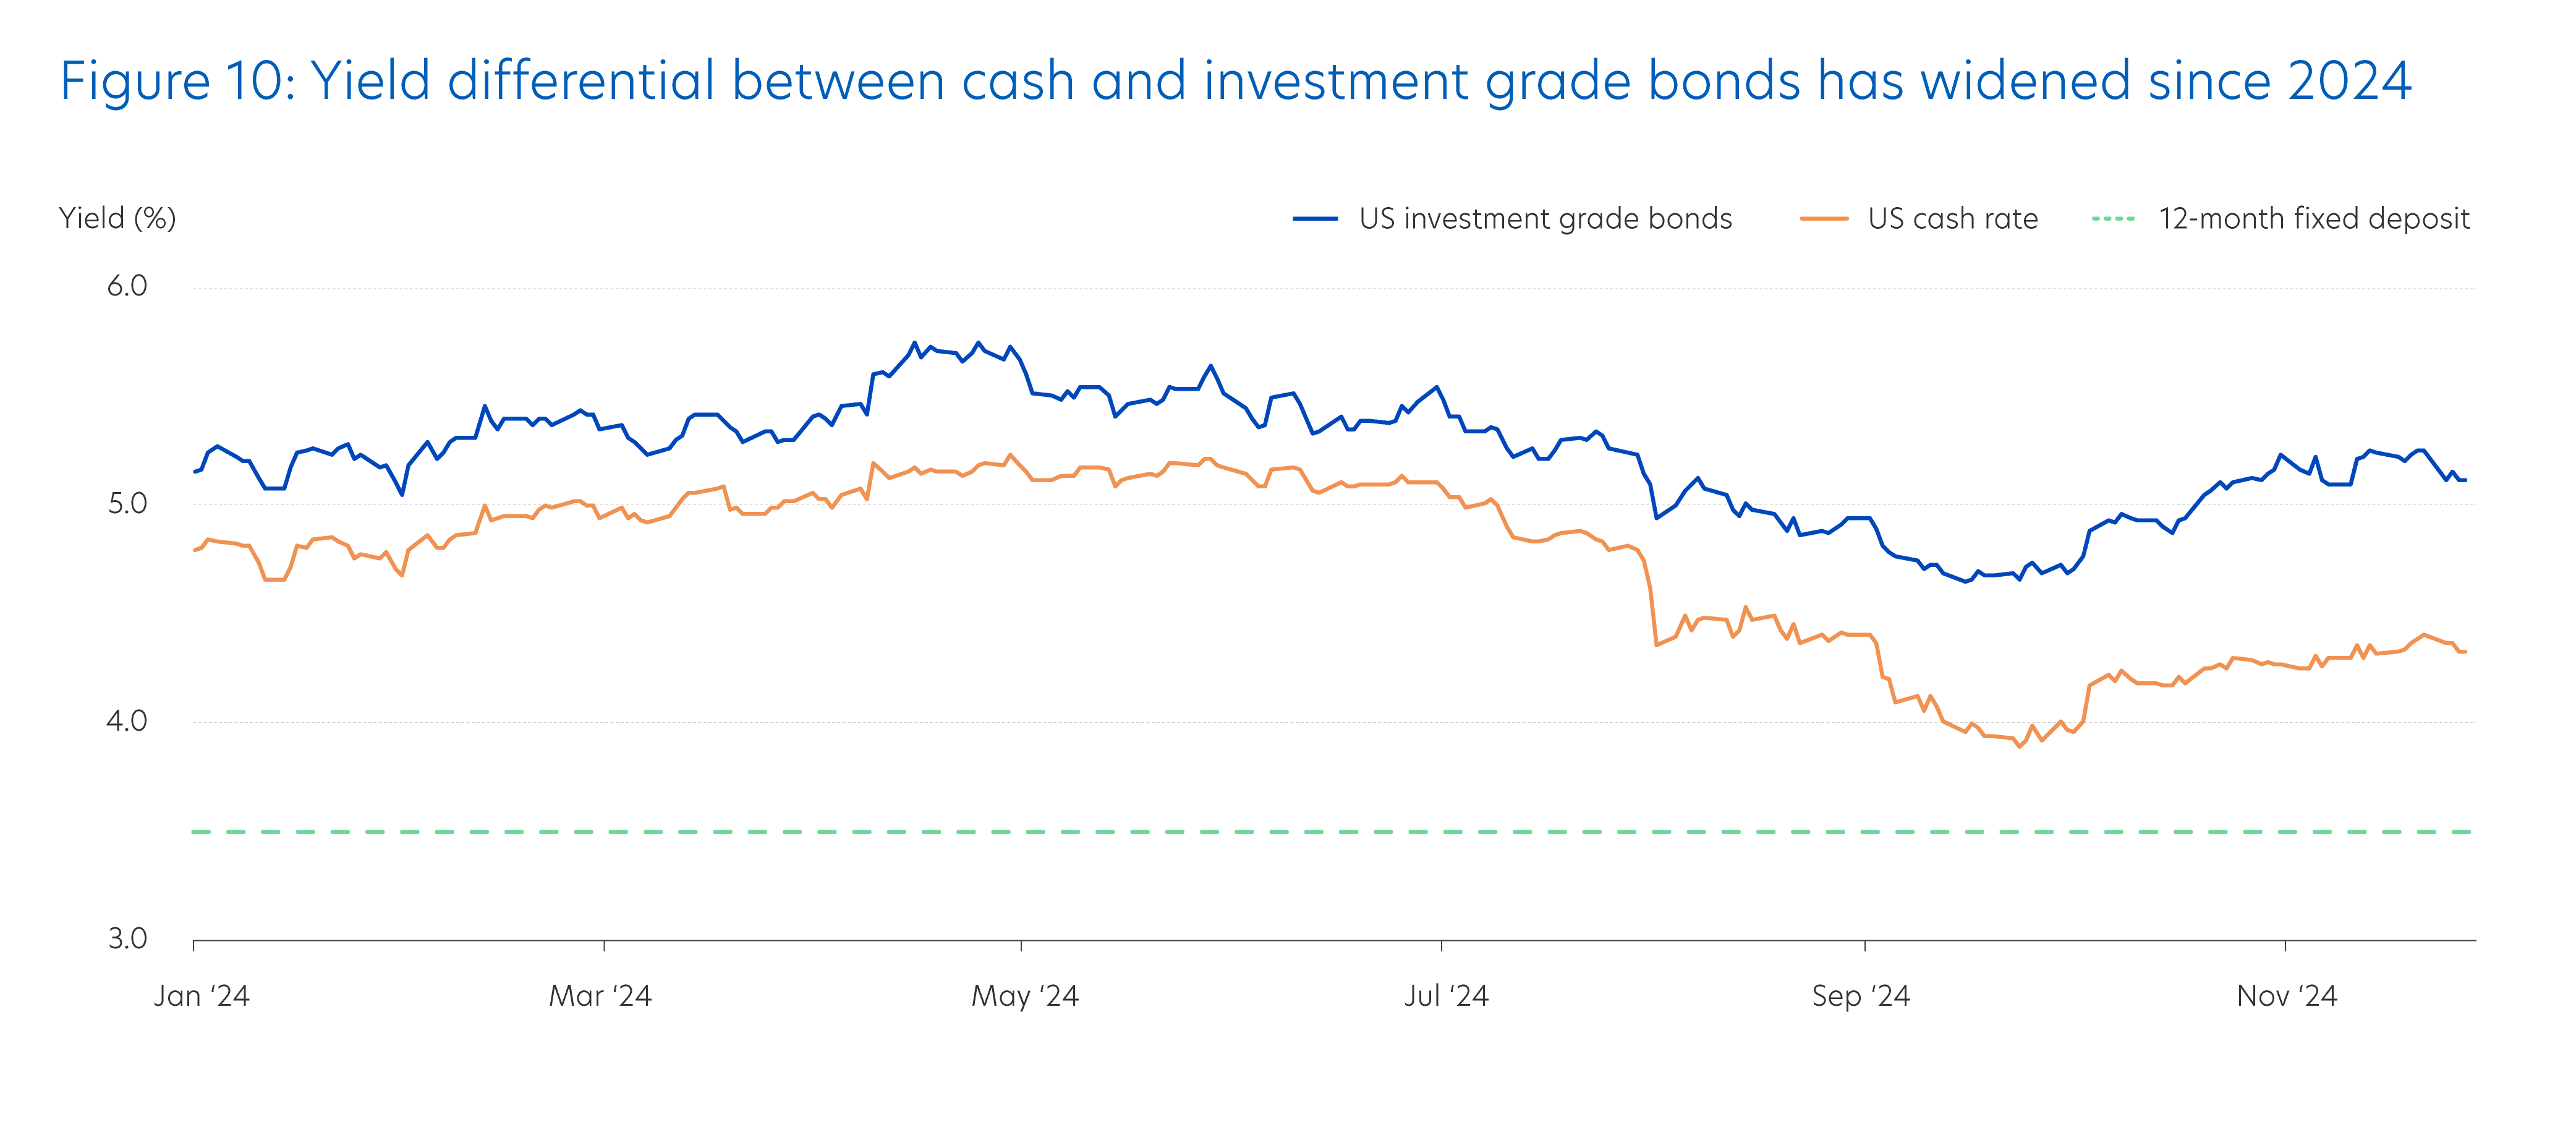
US cash rate refers to US 1-year Treasury bill. US investment grade bonds refers to the Bloomberg US Corporate Bond Index. 12-month fixed deposit refers to UOB US dollar 12-month fixed deposit rate as at 4 December 2024.
Source: UOB Singapore (4 December 2024), Bloomberg (30 November 2024)
Cash or fixed deposits should only be one part of your portfolio
Investors should still be mindful of volatility in 2025 as potential United States (US) policies like tariffs and lower taxes may lead to higher inflation, less rate cuts and higher bond supply by the US Treasury Department. Nonetheless, investment grade bonds are expected to deliver consistent income and offset risks in investors’ portfolios during times of trade tensions and geopolitical uncertainties.
With bond yields still historically high, locking in those yields now will be a good choice for investors seeking reliable income.
Quality dividend stocks provide income and capital growth potential
Dividend stocks are another compelling option for income generation within an investment portfolio. Notably, quality dividend stocks in Asia ex-Japan currently offer an attractive dividend yield of 5.1%![]() , one of the highest globally.
, one of the highest globally.
While investor sentiment in Asia ex-Japan may be weighed down by trade tensions, there are still opportunities worth exploring. Companies with a domestic focus, such as real estate investment trusts (REITs) and utilities, are likely to be less affected by trade uncertainties as compared to those with significant exposure to foreign markets. As reference, during the 2018 US-China trade tensions, both the REITs and utilities sectors delivered positive returns of 10.5%![]() and 7.4%
and 7.4%![]() respectively.
respectively.
In 2025, domestic-oriented companies in Asia ex-Japan are expected to remain comparatively resilient as their profitability depends primarily on domestic demand. This will allow companies to pay consistent dividends, while offer potential capital appreciation, even in the face of external headwinds.
Build a strong income portfolio with compounding wealth effect
As discussed above, investors should build an income portfolio beyond just cash or fixed deposits. While cash and fixed deposits provide safety, their returns often fail to beat inflation, eroding purchasing power over time. In contrast, an income portfolio that consists of quality bonds and quality dividend stocks can deliver higher long-term returns, with dividend stocks providing the added benefit of compounding wealth effect when dividends are reinvested, thereby accelerating portfolio growth (Figure 11).
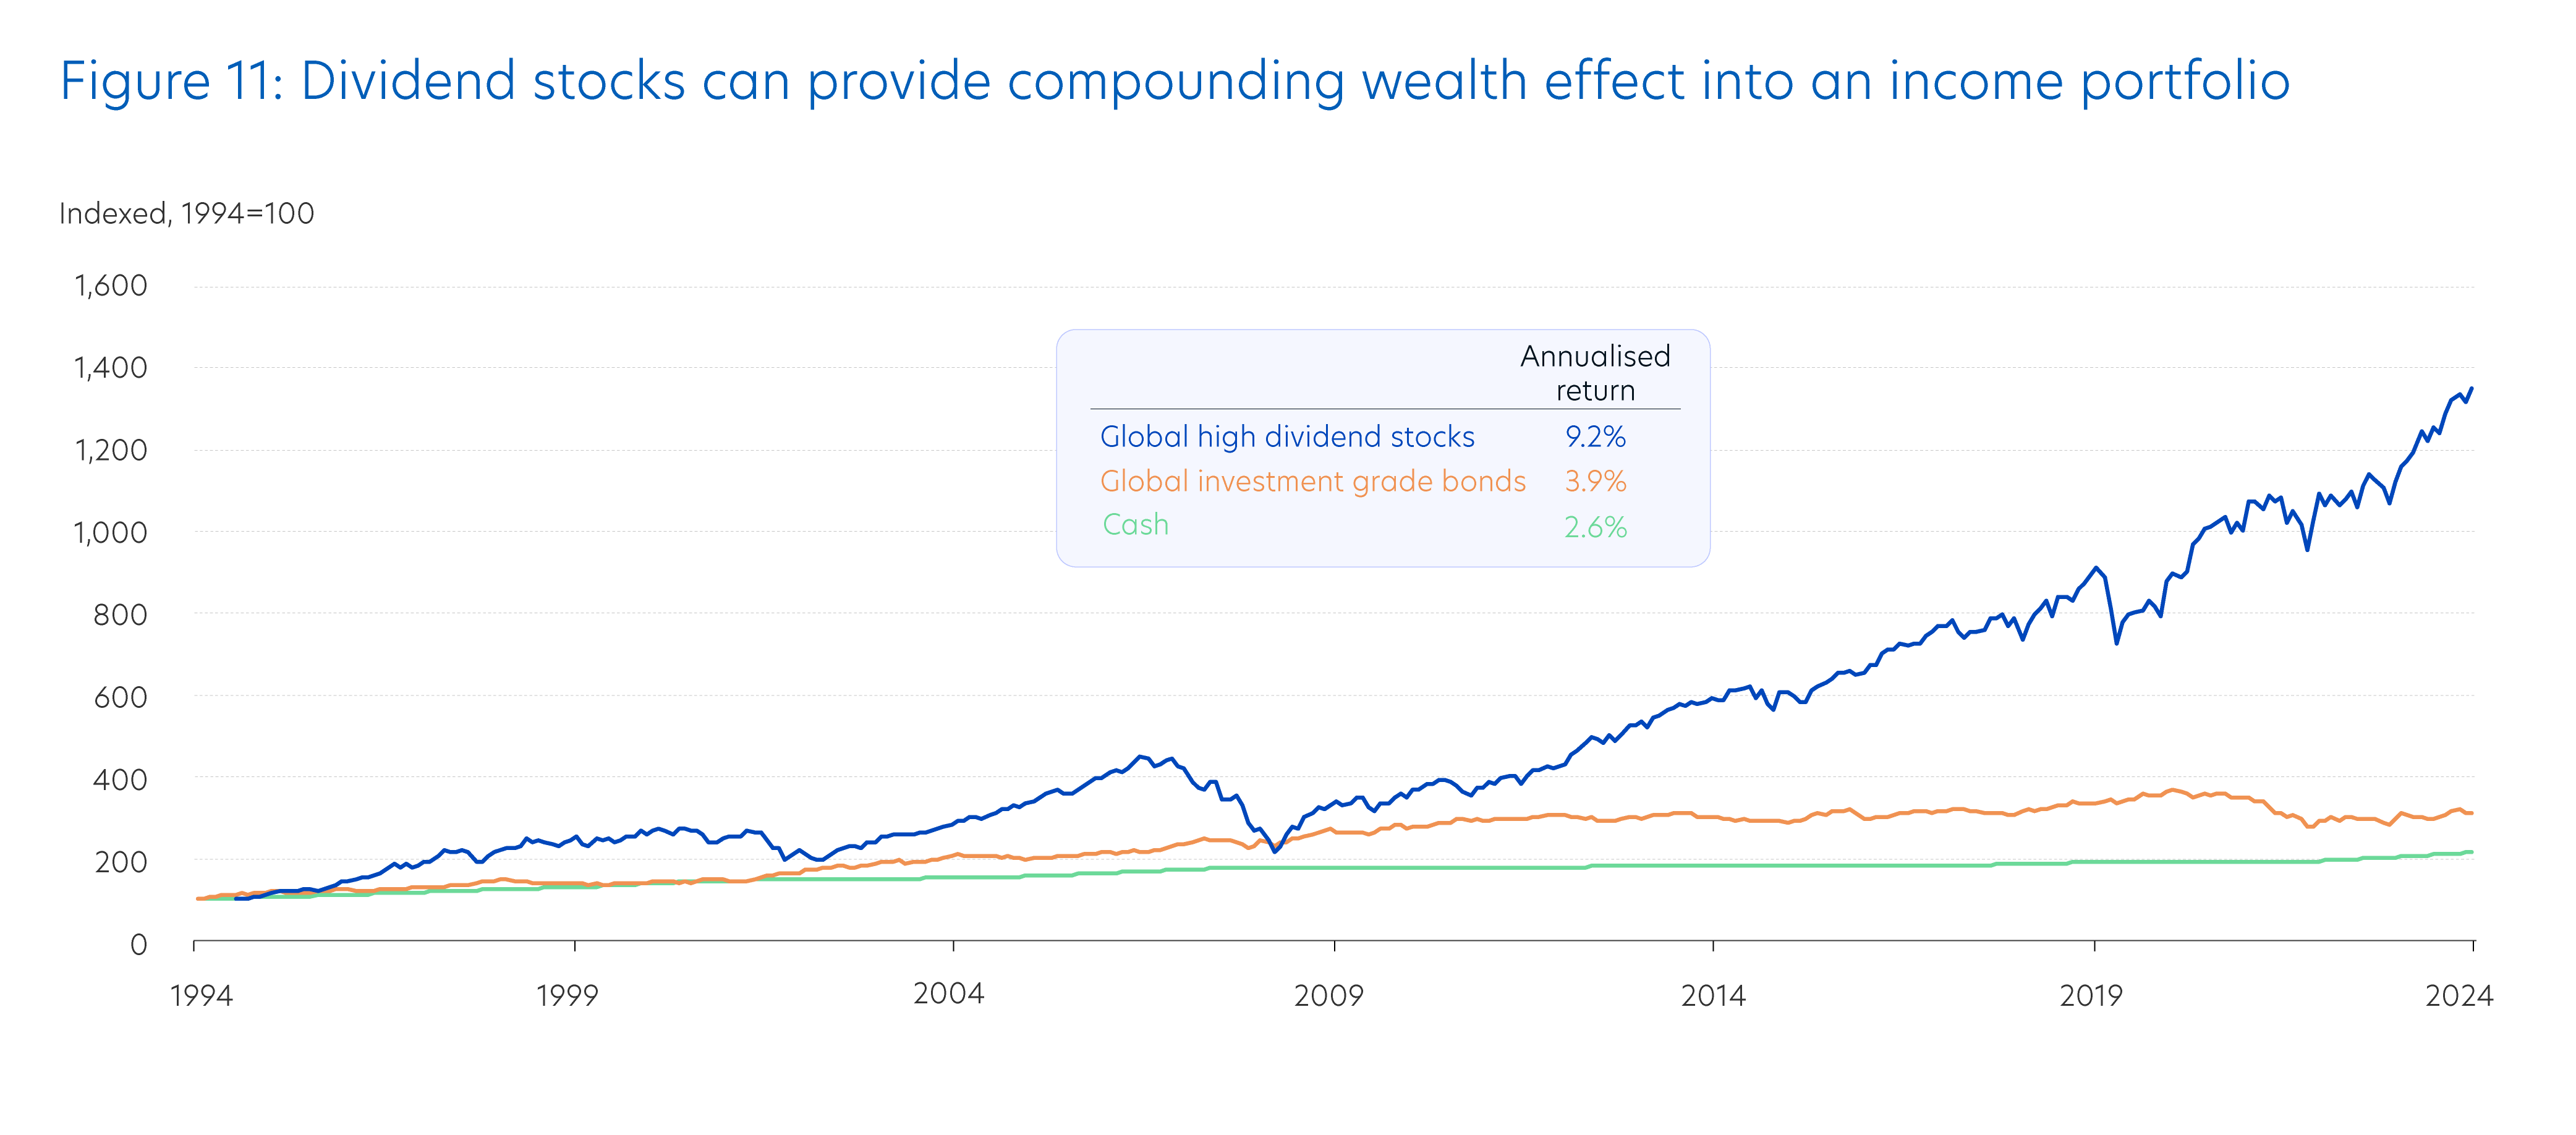
Global high dividend stocks refer to MSCI World High Dividend Yield Index Total Return. Global investment grade bonds refer to the Bloomberg Global Aggregate Index Total Return. Cash refers to US Short Treasury Index Total Return.
Source: FactSet, J.P. Morgan Asset Management (30 November 2024)
Compounding your investment income now, when yields are high for both investment grade bonds and quality dividend stocks, will provide a better starting point towards building a strong income portfolio.
Additional Resources

Contact a UOB Advisor

Download a digital copy
Get more investment insights
Credits
Credits
Managing Editor
- Winston Lim, CFA
Singapore and Regional Head,
Deposits and Wealth Management
Personal Financial Services
Editorial Team
- Abel Lim
Head of Wealth Management Advisory and Strategy,
Deposits and Wealth Management,
Personal Financial Services
Editorial Team (cont’d)
- Tan Jian Hui
Wealth Management Advisory,
Deposits and Wealth Management,
Personal Financial Services - Low Xian Li
Wealth Management Advisory,
Deposits and Wealth Management,
Personal Financial Services - Zack Tang
Wealth Management Advisory,
Deposits and Wealth Management,
Personal Financial Services
Important notice and disclaimers
The information contained in this publication is given on a general basis without obligation and is strictly for information purposes only. This publication is not intended to be, and should not be regarded as, an offer, recommendation, solicitation or advice to buy or sell any investment or insurance product and shall not be transmitted, disclosed, copied or relied upon by any person for whatever purpose. Any description of investment or insurance products, if any, is qualified in its entirety by the terms and conditions of the investment or insurance product and if applicable, the prospectus or constituting document of the investment or insurance product. Nothing in this publication constitutes accounting, legal, regulatory, tax, financial or other advice. If in doubt, you should consult your own professional advisers about issues discussed herein.
The information contained in this publication, including any data, projections and underlying assumptions, are based on certain assumptions, management forecasts and analysis of known information and reflects prevailing conditions as of the date of the publication, all of which are subject to change at any time without notice. Although every reasonable care has been taken to ensure the accuracy and objectivity of the information contained in this publication, United Overseas Bank (Malaysia) Bhd. (“UOB Malaysia”) and its employees make no representation or warranty of any kind, express, implied or statutory, and shall not be responsible or liable for its completeness or accuracy. As such, UOB Malaysia and its employees accept no liability for any error, inaccuracy, omission or any consequence or any loss/damage howsoever suffered by any person, arising from any reliance by any person on the views expressed or information contained in this publication.
ny opinions, projections and other forward looking statements contained in this publication regarding future events or performance of, including but not limited to, countries, markets or companies are not necessarily indicative of, and may differ from actual events or results. The information herein has no regard to the specific objectives, financial situation and particular needs of any specific person. Investors may wish to seek advice from an independent financial advisor before investing in any investment or insurance product. Should you choose not to seek such advice, you should consider whether the investment or insurance product in question is suitable for you.

We use cookies in order to provide you with better services on our website. By continuing to browse the site, you agree to our privacy notice and cookie policy.